Appleby History > In Focus > 17 - Population Growth
Chapter 17
The Growth of Appleby's Population
by Richard Dunmore
At the time of the Domesday Survey of 1086, the population of the parish of Appleby was about 130. In the year 2000 the official population estimate was 1103 (1). This represents an increase in population of more than eight-fold. In this article I shall attempt show something of the progress of this rise over a period of almost a millennium.
Methods
Official censuses did not begin in this country until 1801, so at first sight there would appear to be little possibility of finding out what the population was in early times. However, various official enquiries were made into aspects of the parish at particular earlier dates. These enquiries were concerned with factors such as liability for taxation, religious observance, political control or other social investigations. All of these types of enquiry are to be found in Appleby’s past. Of course, they were not intended as a means of measuring the village’s population, but, because they concerned the population as a whole, they can be used to make an estimate for the particular date of each enquiry. The accuracy of the population estimates will vary and depend upon the accuracy of the recorded information and the assumptions made in linking the information to the population count.
A second line of attack is to use the parish registers. From the late 16th century onwards, the parish priest or clerk recorded, more or less faithfully, the baptisms, burials and marriages which took place at the parish church. Most people were baptised, most marriages took place in church, all who died in the parish were buried; and the details were entered into the parish registers. The numbers of these entries over a given period can be used to quantify how the population was changing. This may take the form of the simple equation that the increase in population over the period is given by the difference between numbers of births (baptisms) and numbers of deaths (burials). This is known as the natural growth. This method requires knowledge of the population at a notional ‘starting point’ in order to deduce population progress over the periods before and after this point.
An alternative approach is to use baptism or burial rates, ie numbers of baptisms or burials per thousand population. These are then applied to the actual numbers of baptisms or burials registered over 10 or 20 year periods. The rates have to be assumed constant for the period under consideration. The population is calculated in proportion to the number of register entries: ie the greater the number of register entries the larger the population. (Marriages are not usually used in this way because the numbers involved are relatively few.)
Difficulties arise using parish registers when there are periods of migration into or out of the parish; when there is a significant amount of religious non-conformity; or when civil disturbance leads to under-registration, but these effects are usually easy to recognise.
The Cambridge Group for the History of Population pioneered work in this field in the 1960s (2). My own work on Appleby Registers was written in 1973 (3).
Estimates from Particular Enquiries
The earliest estimates of population for the village come from the Domesday Book together with some local surveys made shortly afterwards.
Domesday Survey 1086
Appleby has entries in the Domesday returns which refer to three parts of the village (4):
- Appleby Parva (Leicestershire) owned by Henry de Ferrers (1 carucate or 120 acres);
- Appleby Magna (Leicestershire) which had belonged to Countess Godiva (3 carucates);
- and Appleby Magna (Derbyshire) which was the land of Burton Abbey (5 carucates).
The workforce recorded in the Survey falls into two distinct groups: free-men and serfs.
In 1086, Henry de Ferrers’ land at Appleby Parva was farmed by four sokemen and these were the only free-men in the parish.
On the land which had been Countess Godiva’s there were in all 14 serfs: 8 villeins and 6 bordars (lesser serfs); Burton Abbey had 9 serfs: 8 villeins and one bordar. The total numbers of serfs in the parish was therefore 23 and the overall manpower of the parish (freemen and serfs) was 27.
Burton Abbey Surveys 1100-1114
Two surveys were made of the land of Burton Abbey at Appleby ‘at the time of King Henry I and Abbot Nigel’, ie between the years 1100 and 1114, the time span during which their periods of rule overlapped (5). These surveys are much more detailed than the Domesday Survey, but in each case the total numbers of serfs is 23.
The Leicestershire Survey 1129-30
In 1129-30 another survey was carried out which was unique to Leicestershire, the so-called Leicestershire Survey (6). For Appleby this lists only the land of Robert de Ferrers (Henry’s son and heir). Although there is little detail and nothing about manpower, it is clear that the small (1 carucate) farm at Appleby Parva was still thriving. There was no mention of Countess Godiva’s old estate, but Robert had a second smaller holding (½ carucate or 60 acres) which may be a remnant of her estate which he had acquired.
What appears to have happened after the Norman Conquest is that, after Godiva was dispossessed, her land was abandoned and the workforce of serfs was taken over by Burton Abbey. There are good reasons to believe that this could have taken place. There was already a close relationship between the Countess and Burton Abbey. Leofric, Earl of Mercia and Godiva’s late husband, had appointed his nephew, also Leofric, to be Abbot of Burton in 1051 so the Abbey was in Leofric and Godiva’s patronage (7). Also before the Conquest the Abbey had leased 120 acres (1 carucate) of their holding to the Countess. Although his own land holding was unchanged by the Conquest, the Abbot would not have been slow to make use of the unemployed manpower when Godiva’s land was neglected.
Many of the workforce were named in each of the Burton Abbey Surveys. Although the individuals changed between the two, the numbers of serfs remained constant, at 23, for all three surveys (Domesday and Burton Abbey). The Ferrers’ farm at Appleby Parva, run by the four free-men, remained undisturbed independent of the changes at Appleby Magna.
Population around 1100
The total workforce in the parish from 1086 through into the 12th century therefore was probably 27, made up of 4 free-men and 23 serfs, one of whom was also a priest (although this was not mentioned in the Domesday Survey). Assuming that each man, except the priest who would have been unmarried, had four dependants the population would have been about 130
The Poll Tax of 1377
The next estimate of the population is made possible by the poll tax collected in 1377, after the death of King Edward III (8). This unpopular tax brought in one groat (4d) per head from everyone aged 14 years and over. The number of people taxed for Appleby parish was 94.
There are problems about estimating the population from these head-counts. How many people managed to evade the tax, especially in the wake of the first outbreaks of the Black Death (1348, 1361, 1369 and 1375); and how many children were there under the age of 14 years anyway? Demographic historians differ in their answers to these questions but, if we assume 15% evasion and 40% under 14 years, the 1377 village population works out at around 180.
The Black Death
The population of England as a whole is thought to have risen from about 2 million at the time of the Domesday Survey up to a maximum of perhaps 6 million around the end of the 13th century. When the first outbreak of the Black Death (bubonic plague) occurred in 1348, a down-turn in population was already under way caused by climatic changes and over-exploitation of the land. There were particularly bad harvests in 1315, 1316, 1320 and 1321.
Between 1348 and 1377 the mortality caused by the plague was catastrophic. It has been estimated that more than half the inhabitants of England died in this period, with the population down to perhaps 2.75 million by 1377. Further outbreaks continued to take their toll and the population fell back to Domesday levels by the mid 15th century. Recovery thereafter was slow (9).
Little evidence exists of the direct effect of the Black Death upon Appleby itself. The plague affected every part of England and the villagers could not have escaped its dreadful toll. Sir Edmund de Appleby (d. 1375) was lord of the manor of Appleby Magna during this period. In the 1340s, before the first outbreak, a new church, a substantial stone building was erected, which is essentially the church we have today. This is an indication that the village had prospered in the period after the Norman Conquest and that its population had steadily grown with that of the country as a whole, until the disaster of the Black Death in the 14th century caused it to fall so drastically.
What then was the height of Appleby’s population at the end of the 13th century, ie before the down-turn began? Using the proportionate change for the country as a whole, the answer comes out at about 400. By 1377, the effects of the plague had reduced it to 180 and a fall back towards the Domesday level of 130 continued into the 15th century.
Episcopal Visitation Books: ‘Liber Cleri’ 1603
To ensure proper observation of the canon laws of the Elizabethan Protestant settlement, the Bishop of each diocese carried out ‘visitations’ of his parishes, at which he required the clergy and churchwardens to answer standard questions about all aspects of the parish. These visitations were usually carried out at three year intervals following an initial visitation following the Bishop’s enthronement. The results of these enquiries were entered into special Call Books or Liber Cleri (10).
The enquiry carried out at Appleby in 1603 revealed 225 communicants in the parish. There is no record here of any recusants or non-conformists (11).
Estimates of the proportion of the population too young to take communion vary between 33.3% and 40%. Taking an intermediate value of 36%, this gives a population estimate of about 350. We may deduce from this that the village population had been recovering from the Black Death and was growing throughout the 16th century. It was once again climbing towards the peak level attained at the beginning of the 14th century.
Oath of Protestation February 1642
The Parish Registers of Appleby church list the 144 people (143 men and one woman) aged 16 years and over, who signed the Oath of Protestation of February 1641/42, together with the wording of the Oath itself (12). Such lists have not generally survived but the rare Appleby list did so because the local church made this copy in the registers. The wording is given in full in the Appendix.
Those signing the oath pledged to maintain the true reformed protestant religion expressed in the doctrine of the Church of England as well as his Ma[jes]ties Royall p[er]son and also the power and priveledge of Parliament. It was a belated attempt to avoid civil war by uniting the country in opposition to the perceived common enemy of Roman Catholicism.
As there were very few Roman Catholics, if any, in the parish we have an almost complete list of all the men over the age of 16 years at that date. The one woman who signed may have done so on her husband’s behalf. Examination of the actual register entries for the period shows that all the names are authentic and that there were at least two men whose names are absent. Correcting the male adult population by +2% and assuming that 40% of the inhabitants were children under 16, the total population of the parish for February 1642 works out at 490. Because of the authenticity of the name list, the margin of error on this estimate must be quite small. This figure is therefore the most accurate count of the village population before the official censuses began in 1801.
Hearth Tax 1662/1670
By Act of Parliament 1662, a tax was imposed of 2 shillings on every hearth, unless the householder was exempt on grounds of poverty (13). Records exist for the Derbyshire part of Appleby for the year 1662, and for the Leicestershire part for 1670.
The 1662 Derbyshire list gives the hearths that were taxed (and not those that were exempt), but it does give the names of all the householders and the number of hearths each possessed (14). For the Leicestershire tax of 1670, we have 17 hearths exempt as well as 30 that were taxed (15).
Assuming a multiplier of 4.5 people per hearth and making a (downward) correction to allow for distortion of the figures by one large household with 13 hearths, this gives a population figure for the whole village of around 510 (16).
Compton Census 1676
The Compton Census of 1676 is named after its initiator Henry Compton, Bishop of London. This census was intended to discover the number of Anglican conformists, Roman Catholic recusants and Protestant dissenters in England and Wales from enquiries made in the individual parishes. The surviving return for Appleby of 240 communicants provides another measure of the population.
Assuming children below the age of confirmation to be 40% of the population, this gives an estimate of the total population of 400.
Compared with the estimates obtained from the 1642 Protestation Return (490) and the 1662/1670 Hearth Tax (510) this figure is rather low and requires an explanation. There was no dissenters’ meeting house in the parish in 1669 and non-conformity in the parish was apparently insignificant (17). Equally, there is no evidence of migration out of the parish at this time.
My analysis of parish register entries (see below) shows a generally rising trend throughout this period, although there is evidence from recorded baptisms of a drop in survival rates of new born children between the years 1670 and 1690 (and between 1710 and 1730). So a real short-term drop in population may have occurred. An explanation may be found in poor diet and disease. Malnutrition or famine resulting from bad harvests resulted in increased susceptibility to fatal diseases. Such reversals were not uncommon in those times (18).
Pilkington’s ‘View’ of 1789
James Pilkington published his View of the Present State of Derbyshire in 1789. He noted that in Appleby, there were ‘59 houses in Derbyshire’, another indicator of the size of the village. Converting this to a population figure however, requires knowledge of not only the average number of people living in each house, but also the equivalent figures for the Leicestershire part of the village.
John Nichols’ volume covering Appleby and published in 1811, gives a breakdown of the houses between the two counties to coincide with the first official census of 1801 which gave the population as 935. Nichols tells us that of these 935 people, 478 lived in 116 houses in Leicestershire; 3 further houses were uninhabited. In the Derbyshire part, 457 people lived in 98 houses with a further 4 houses uninhabited (19).
It is tempting to work out a population figure from Pilkington’s 1789 observation (59 houses) using proportions from Nichols’ detail. The average occupancy of each house in 1801 was 4.37. Applying this multiplier to 1789, the population estimate for the whole village would be 563. However, the large rise in the numbers of houses recorded in the Derbyshire part of the village, from 59 houses in 1789 to 98 in 1801, must mean that many new houses were built in that 12 year period. Consequently we might expect the houses of 1789 to have been of poor quality and very overcrowded. The occupancy of each house was therefore much higher than in 1801 and the same multiplier does not apply. So the calculation is not valid.
But was an attempt made in the late 18th century to improve the housing of the villagers? The answer must be yes. We have already seen that the absentee Lord of the Manor, Charles Moore, succeeded in getting the open fields enclosed in 1772. The Moores were reaping the benefit of the enclosures at this time and building large houses for themselves: Appleby House and the White House (20). Furthermore, the rectory had acquired a large estate of glebe land (the Rectory Farms) and a new rectory was under construction (21). Improving the housing of the villagers was not entirely an act of philanthropy. It would have been in the best interests of the major landholders, the Moores and the rector, to improve the conditions of their workmen, regarding them as a resource of their estates.
Official Censuses
The first official census in this country took place in 1801 and, with the exception of 1941, every 10 years thereafter. The population figures for Appleby from 1801 to 1951 may be found in the Victoria County History of Leicestershire (22).
Census Population Figures for Appleby
Year |
1801 |
1811 |
1821 |
1831 |
1841 |
1851 |
1861 |
1871 |
1881 |
Total |
935 |
1123 |
1185 |
1150 |
1075 |
1181 |
1070 |
885 |
757 |
Year |
1891 |
1901 |
1911 |
1921 |
1931 |
1951 |
2000 |
Total |
657 |
649 |
675 |
752 |
763 |
829 |
1103 |
Natural Growth
From the late 16th century, Appleby Magna parish registers list the baptisms and burials which took place at the parish church. Although there are certain periods when under-registration is suspected, for example around the time of the English Civil War, the difference between the cumulative numbers of baptisms and the numbers of burials gives a numerical measure of the increase of population: the Natural Growth. Of course it presupposes that no-one moved into or out of the village and that all baptisms and burials were recorded. From the beginning of the registers up to about 1720 this would appear to have been the case. At worst, migration into and out of the parish cancelled out. From that date (c.1720), with increasing development of industry, the drift of people from villages to the industrial towns grew at an increasing pace helping to satisfy the manpower requirements of the Industrial Revolution.
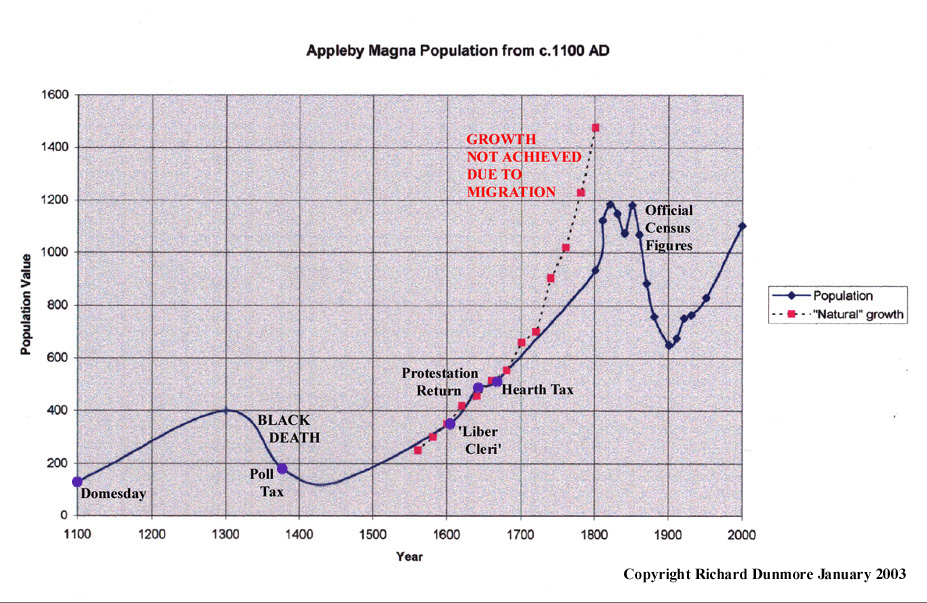
I have calculated the Natural Growth line for Appleby’s population, using counts of the parish register entries and using the most reliable spot value mentioned above (the Protestation Return level of 490 at 1642) as a starting point. This growth line is drawn on the graph below for comparison with a (smoothed) line constructed from the spot values which cover the years from Domesday to the years of the official censuses.
Click for larger view
The graph shows the village population growing with the country as a whole in the 12th and 13th centuries from the Domesday level of 130 to a peak of about 400 around the year 1300. The catastrophic effect of the Black Death is shown in the rapid decline during the 14th century to the Poll Tax figure of about 180 in 1377. Continuing to fall to the mid 15th century, the population then steadily picked up again through the 16th century. Apart from short-term set-backs (not shown), the level rose at an even greater rate during the 17th and 18th centuries reaching 490 by 1642 and passing 600 by the year 1700.
From the late 16th century up to the early decades of the 18th century, the population closely followed the Natural Growth line (shown in red on the graph). If the population had continued to grow at this rate, the village population would have soared, but clearly this did not happen. The reason is to be found mainly in migration away from rural areas to the growing industrial towns.
The census figures show the population rising through the 1000 mark soon after the year 1800, with levels well above 1000 between 1811 and 1861. Some of the fluctuations in this period may be due to the uneven success of Appleby School in attracting boarders (22).
Economic Vagaries
The population of the village depends upon the local economy, the provision of housing and of employment in particular. I have suggested above that there was a large improvement in housing provision in the late 18th century. Further improvements to the housing stock of the village were carried out in the 1830s (20). Along with this there must have been sustained employment. The Moores as local landowners and employers were responsible for this and the maintenance of the high level of population during the first half of the 19th century derive ultimately from squire George Moore’s improvements and management of his estate.
Conversely, the decline of population in the latter half of the 19th century must be related to not only the competing attractions of prospering local industry, at Ashby Woulds and Measham, but also to the effect of prolonged agricultural depression on the Appleby estate. A clear sign of these difficulties is that the next squire, George J Moore, was in severe financial difficulties by the 1880s (23). The population level reached a low point of 649 in the year 1901. Since then Appleby’s population has risen throughout the 20th century and today stands above 1100 once more.
Notes and References
1. North West Leicestershire Mid Year Population Estimates, Leicestershire County Council 2001; see www.leics.gov.uk/p_t/policy_research/population/parish_nwest.htm
2. E.A. Wrigley, An Introduction to English Historical Demography, Weidenfeld & Nicholson, 1966; see also Alan Rogers, This Was Their World - Approaches To Local History, BBC, 1972: Chap II ‘The Size of the Community’ gives a useful introduction to population study.
3. R Dunmore The Parish Registers of Appleby Magna, Leicestershire, Local History Certificate Research Essay, University of Keele, 1973; I have taken the opportunity here to update my estimates.
4. See In Focus 4 (Domesday Survey)
5. See In Focus 8 (Burton Abbey’s Surveys)
6. Victoria County History (VCH) Leicestershire I, 1907, p 351 (Leicestershire Survey)
7. See In Focus 6 (House of Leofric)
8. Raw population data from the various enquiries may be found in VCH Leicestershire II and III; and VCH Derbyshire II.
9. J L Bolton, The Medieval English Economy 1150-1500, Dent, 1980; in Chapter 2 the author discusses the evidence on which the estimates of the population loss resulting from the Black Death are based. For example, data survives for the privileged echelons of society in the form of Inquisitions Post Mortem which recorded the experience of the tenants-in-chief (barons); and in diocesan records for the mortality of beneficed clergy. Both groups may be regarded as atypical of society as a whole, but the clergy at least were in constant contact with ordinary people so that their exposure to disease was similarly high.
10. Dorothy M Owen, Episcopal Visitation Books, Short Guides to Records No. 8, Historical Association.
11. Although a presbyterian minister was imposed by the Parliamentary Committee in 1655 (until the restoration in 1660), there were no non-conformist meeting houses in Appleby in 1669 (see 17. below). It seems likely therefore that dissent had no great following locally at this period.
12. Appleby Magna Parish Registers: the Protestation list and Oath may be found inserted within the normal entries (baptisms &c) for 1648.
13. Roger Howell, Hearth Tax Returns, Short Guides to Records No. 7, Historical Association. The 1662 tax was a supplementary means of raising more revenue when Parliament’s initial grant to Charles II’s government proved inadequate to meet its ordinary peace-time expenses. In the face of negligence and evasion, a 1663 modification of the Act required all hearths to be listed (not just those taxed) and in 1664 the responsibility for tax collection was given to new officials called chimney men.
14. The names of those Appleby householders who were assessed for Hearth Tax in Derbyshire were transcribed by the Derbyshire Record Society in 1982. The may be found on-line at: http://freepages.genealogy.rootsweb.com/~brett/census/app1662_ht.htm
15. VCH II, p 172 (Hearth Tax, Leicestershire)
16. The number of taxed hearths in the Derbyshire half in 1662 was 52 of which 13 hearths belonged to one household (a Mr Kendall). This large household clearly distorts the numbers used as a population count. Apart from three individuals who had had 2 hearths, all the others only had one. For the purpose of this calculation I have therefore reduced Mr Kendall’s household to 3 hearths, so the corrected total number of taxed hearths becomes 42. If we assume also that proportionately there were just as many exempted hearths in the Derbyshire part as in Leicestershire, the exempted hearths in Derbyshire would have numbered 24. So we arrive at totals of 47 hearths in Leicestershire and 66 (corrected) in Derbyshire, an overall total of 113. Using the multiplier of 4.5 recommended by Roger Howell (see 13.), this gives a population figure approaching 510.
17. RH Evans, Non-conformists in Leicestershire 1669, TLAS 25, 1949, pp124-5 Sparkenhoe Deanery. Certificate of the Clergy concerning Conventicles (non-conformist meeting houses) taken at the visitation of Dr Outram Archdeacon of Leicester 13 Oct 1669: Appleby: The minister being sicke the Churchwardens certifie yt there is noe conventicle within this parish. Samuel Torrell, John Hunt, churchwardens.
18. See for example Eileen A Gooder, ‘The Population Crisis of 1727-30 in Warwickshire’, Midland History Vol. I No. 4, 1972
19. J Nichols, op cit p 431 Nichols gives a breakdown of the 1801 census population figure of 935. As the returns were not kept these details would otherwise have been lost. He wrote:
By another Return to Parliament in 1800 [sic], that part of Appleby which is within the county of Leicester contained 116 inhabited houses, and 3 uninhabited. The families were 167; consisting of 223 males, and 255 females, in all 478; of whom 223 were chiefly employed in agriculture, and 204 in trade, manufactures, &c. In the Derbyshire part, there were 98 inhabited houses, and 4 uninhabited. The families were 99; males 299 [this should be 229], females 228; total 457. Of these, 182 were chiefly employed in agriculture, and 238 in trade, manufactures &c.
20. In Focus 13 (enclosures, grand houses and village housing improvements)
21. J Nichols, op cit p 432 (new rectory)
22. VCH Leicestershire III, 1955, p 180. The 1821 figure was said (in 1831) to have been erroneously high. Comments on the 1841 and 1861 figures refer to changes at the ‘endowed grammar school’. The decrease in 1861 is also partly attributed to migration. My total for 1891 has been deduced from the actual returns, as the VCH gives only the Leicestershire part. No census was held in 1941 during the war.
23. In Focus 14, ‘Decline of the Moores at Appleby Parva
©Richard Dunmore, January 2003
APPENDIX: Oath of Protestation February 1642 [from Appleby Parish Registers]
[Signatories:] Sr Will Joanes, Knight, Tho Mould Rector, Abraham Mould, John Rolet, Charles Moore, Will Proudman, Rich. Walker, Edward Heifeild, John Mould, Joseph Grundy, Tho Holding, Peeter Wright, Ralph Proudman, John Petcher, John Shilkton, John Heifeild, John Voton, Rich. Mould, John Frisbie, Will. Stoks, John Hunt, John Pratt, Will. Holding, Tho. Wilson, John Erpe, Will. Robinson, Tho. Swane, Tho. Prat, Tho. Mould, Henry Erpe, Henry Mould, Edward Bull, Tho. Spencer, Aldridg Orton, Will. Stanton, Abraham Shilkton, John Wright, Will. Smith, Will. Heiward, John Cooper, Roland Streton, Charles Mosely, Ralph Heiffeild, Will. Smith, Will. Smith, Tho. Mosely, Joseph Jordaine, Edward Caton, Rich. Proudman, Robert Feilding, Tho. Hartill, James Crosland, John Proudman, Will Heifeild, Edward Moore, Will. Frisbie, Tho. Wilson, Peeter Petcher, Henry Cooper, Will. Foster, John Ashmoore, David Walker, Job Shilkton, Abraham Tabernor, Henry Baker, Abraham Foster, Isack Shilkton, Will. Frisbie iu [jun], Mathew Swane, Charles Wright, John Muchell, Rich. Wathew, Rich. Erpe, Will. Wilson, Rich.Wright, John Petcher, Tho. Heifeild, Tho Mould, Henry Tayler, John Durdane, Joseph Mould, John Wilson, John Clearke, John Wathew, Tho. Mould, Tho. Petcher, Abraham Ours, John Mould, Henry Durdane, John Swane, Sammuel Stretton, Francis Berry, Will. Prat, John Smith, Will. Tomson, George Choyce, Tho. Smalewood, John Foster, Will. Smalewood, Abraham Foster, Tho Petcher, Joseph Baker,Tho Brodebent, Will. Bull, Will. Heifeild, Roger Tayler, Tho. Foster, Will. Foster, Luis? Walker, Will. Stanton, John Pratt, Nicolis Mould, Abraham Shilkton, Tho Tayler, Francis Parker, George Hackit, Charles Walker, Charles Moore, Richard Shilton, Matthew Swane, Sen:, Elizab. Tarleton, Matthew Prat, Will. Petcher, Rich. Colton, Will. Tabourner, Sammuel Foster, Tho. Foster, Will. Flalie, John Prat, John Ours, Robert Hayward, Tho. Heifeild, Robert Wilson, Tho. Taborner, Robert Wilcox, Hen. Baker, Ju., Edward Walker, Rich. Stretton, Abraham Crosland, Tho. Wilson, Rich. Mould, Nicolis Wright,Robert Woods, George Dane
“The propestation made by ye house of Parliamt to be taken of every one fro the age of 16 years & upwards Ano Dom: 1641 Feb. 27. [1642 modern calendar]
I A.B. doe in the prescence of Almighty God, promise, vow & profess to mainetaine and defend, as farre as lawfully I may wth my life, power, and estate, the true reformed protestant religion expressed in the doctrine of the Church of England against all popery and popish innovations within this Rhealme contrary to the same doctrine, And according to the duty of my allegiance, his Maties Royall pson, honour and estate, As allso the power and priveledge of Parliament, The lawful rights and liberties of the subject and every person that maketh this protestation in whatsoever he shall doe in the lawfull pursuance of the same, And to my power, and as farre as lawfully I may, I will oppose, and by all good wayes and meanes endeavour to bring to Condigne punnishment, all such as shall either by force, practise, Councells, plotts, Conspiracies or otherwise, doe any thing to the Contrary of any thing in this present protestation Contained, And further, that I shall in all just and honourable wayes endeavour to preserve the union and peace betweene the three Kingdoms of England, Scotland and Ireland, And neither for hope feare, nor other respect, shall relinquish this promise, vow, and protestation.
March the 11 betwixt 5 and 6 in the morneing. [crossed out]
February the 12 betwixt 5 and 6 in the Morneing.”
Previous article < Appleby's History In Focus > Next article